When Hiram Licea relocated to Denver’s Westwood neighborhood in 2012, he moved into a house with no air conditioning. “We spent one summer without it,” he says, “and it was miserable. There were no parks in walking distance. There were hardly any trees. Where do you find shade?”
Denver’s temperature topped 90 degrees on 73 calendar days that year, including one stretch of 24 days in a row. Both figures are all-time records. But if climate forecasts are accurate, that type of summer could become the rule rather than the exception by mid-century—and the health effects will fall disproportionately on neighborhoods like Westwood.
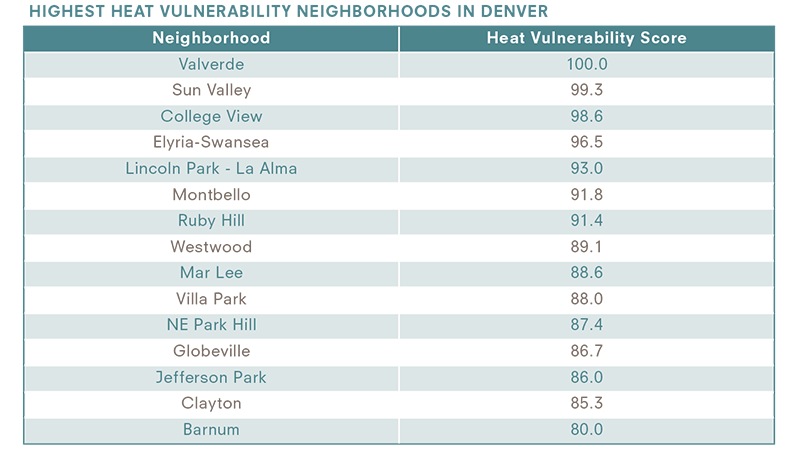
That’s one of the findings of the Denver Heat Vulnerability Map, published earlier this year by the city’s Department of Environmental Health (DEH). Designed to help city officials and residents plan for the effects of global climate change, this interactive tool assigns every Denver neighborhood a Heat Vulnerability Score that reflects its capacity to adapt to rising temperatures. Although the health equity implications of climate change have garnered scant media attention, they’ve emerged as a major focus among policy makers and social service providers.
“Vulnerable populations such as communities of color, the elderly, young children, the poor and those with chronic illnesses bear the greatest burden of injury, disease and death related to climate change,” notes the American Public Health Association, which declared 2017 “The Year of Climate Change and Health.” The states of Oregon and California have established stand-alone programs dedicated to this issue. At the federal level, the National Center for Environmental Health (operated by the federal Centers for Disease Control and Prevention) has established a Climate and Health Program to help states and cities identify vulnerable populations and tailor their climate-change adaptation strategies accordingly.
Researchers have only recently begun to sift the data. One of the earliest and largest research projects, the California Environmental Health Tracking Program (CEHTP), has been monitoring heat-related illnesses and deaths since 2001. CEHTP developed one of the first vulnerability assessment tools in 2011, focused on Los Angeles and Fresno. It found that African Americans and Latinos in Los Angeles were about 50 percent more likely than whites to live in neighborhoods highly vulnerable to climate change—and 100 percent more likely in Fresno.
Denver’s Heat Vulnerability Map uses a methodology similar to CEHTP’s study, integrating both geographic and socioeconomic data. The former, measuring each neighborhood’s physical sensitivity to temperature, includes factors such as tree coverage, water features, prevalence of paved surfaces and acres of green space. The socioeconomic indicators include income, education, mobility and age, and gauge the residents’ susceptibility to heat-related health problems.
“If you live alone, if you’re elderly, if you have diseases, if you have a cognitive disability—any of those things puts you at greater risk in the event of extreme heat,” says Elizabeth Babcock, DEH’s manager of air, water and climate. “You’re at greater risk if you live in a neighborhood with a low concentration of parks, which can reduce the ‘heat island’ effect. Some neighborhoods have older buildings that lack central AC.”
All those conditions apply to Westwood, one of 12 neighborhoods the DEH map identifies as highly vulnerable to heat-related health impacts. According to Hiram Licea, many residents there are already suffering.
An insurance agent with offices on Morrison Road in the heart of Westwood, Licea describes one client who had to stop working in July because of the heat.
“He has diabetes, and his feet swell up,” Licea says. “At night he elevates his feet so the swelling can go down, but his apartment was so hot this summer that he couldn’t stay there.” Without proper care, the man’s feet got so swollen he couldn’t put on his work boots. “He showed up at work wearing sandals one day,” Licea says, “and they sent him home.”
“You feel the heat in your whole body, especially your chest,” says artist Santiago Jaramillo, an asthma sufferer who has lived in Westwood his whole life. “The pressure, the heat. It wears you out. I paint murals, so I do a lot of my work outside. But sometimes I can’t even go out and work.”
Jaramillo’s stepson has encountered a different outdoor hazard this summer: allergy attacks. They’re more frequent and more severe during prolonged hot spells, due in part to the increased density of particulates such as ozone, pollen or ash from regional wildfires.
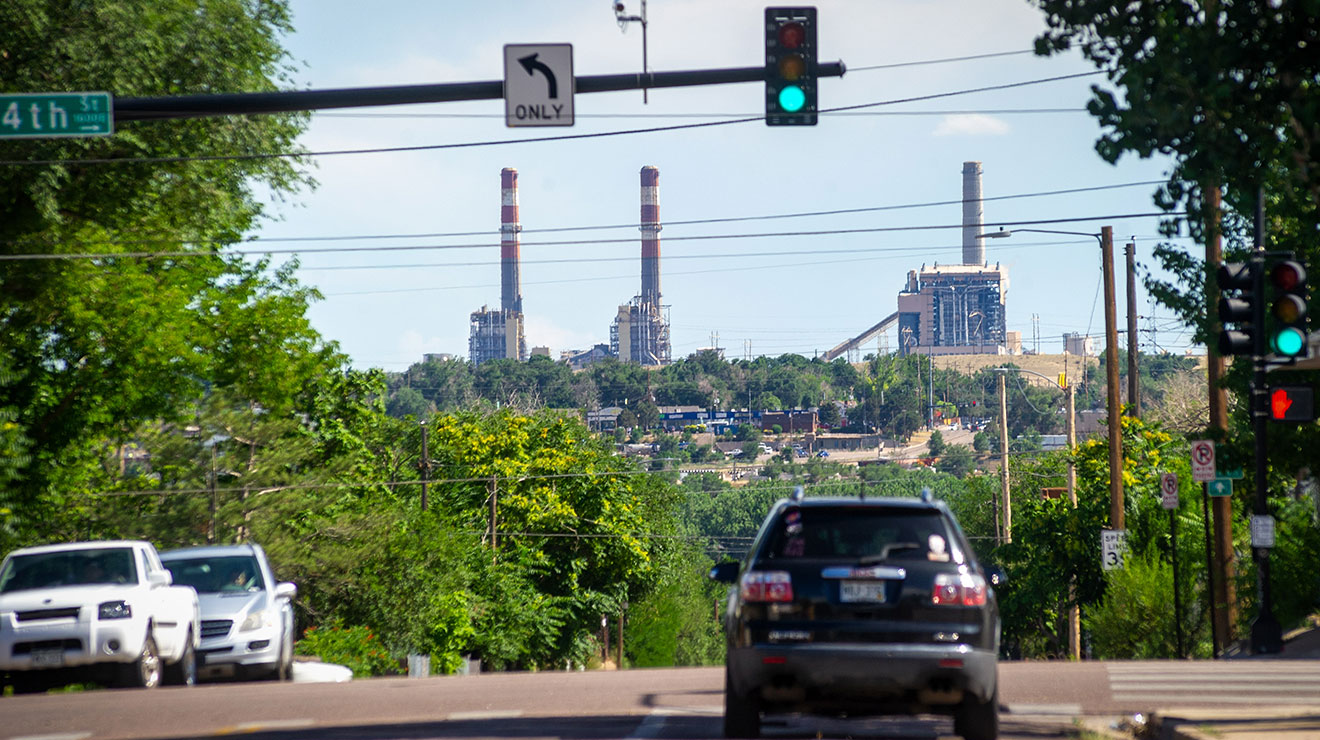
“You’ve got this incredibly complex cocktail of nitrous oxide, sulfur oxide, methane, construction dust, fine particulates,” says Drew Dutcher of Elyria-Swansea, another neighborhood with a high Heat Vulnerability Score. “There’s a serious problem with baseline air quality. Then you add rising temperatures to that, and it only magnifies the impact.”
DEH created the Heat Vulnerability Map primarily to help city officials stay ahead of the climate-change curve. Planners and policymakers can use the tool and its underlying analysis not only to target the neighborhoods with the greatest needs, but also assess which types of interventions will yield the greatest health benefits.
For example, Sun Valley’s heat vulnerability is closely tied to the neighborhood’s poor housing stock and social isolation. That’s critical information for the Denver Housing Authority, which is partnering with the Sun Valley Eco-District to redevelop hundreds of public dwellings in the neighborhood. The current units, which were built in the 1950s, “don’t have any air conditioning and hardly any yard space,” says Jeanne Granville, executive director of the Sun Valley-based Fresh Start Denver. “People in those houses are tolerating extremely warm conditions. But they put up with it because it’s a lower priority than putting food on the table.”
In Elyria-Swansea, the virtual absence of tree cover is a major driver of heat vulnerability. “It’s completely bare,” says Dutcher, who sits on the board of the Elyria-Swansea Neighborhood Association. “We’re way behind the rest of the city. There are no trees.” Multiple city agencies are involved in development projects in the neighborhood along Brighton Boulevard, at the National Western Stock Show campus, and throughout the I-70 corridor. Any or all of those projects could address the canopy deficit.
Whatever its value to government professionals, the Heat Vulnerability Map’s greatest impact may lie in its power to help residents organize themselves and make their own communities more adaptable to climate change.
“In some of these neighborhoods, climate change might not seem super relevant,” says Emily Patterson, local manager of the Trust for Public Lands’ (TPL) Parks for People program. “People have more immediate things to worry about. They don’t feel safe. Their kids are sick. Their rents are rising. Climate isn’t relevant to them until you make it relevant—and health is a way to do that.”
“It’s hard to get people to organize around the potential for extreme heat at some indefinite point in the future,” agrees Wendy Hawthorne, executive director for Groundwork Denver. “But they will get involved if you focus on bringing a higher quality of life to their neighborhood today.
“Having access to parks, having trees in the neighborhood, having energy-efficient homes with lower energy bills—all of those reduce heat vulnerability. But that’s a co-benefit to more tangible gains in the neighborhood.”
In Westwood, TPL and Groundwork Denver are piloting a collaborative approach to climate-change organizing. Working in partnership with the registered neighborhood organization, Westwood Unidos, they’ve launched a coalition known as Cool Connected Westwood (CCW) to gather scientific data and promote green infrastructure development. One project will enlist local residents to measure and monitor heat, shade, water drainage, tree distribution and mobility patterns, with an eye toward identifying priorities for future projects in the neighborhood. Another key initiative is the Via Verde, a local greenway that links a dozen sites and promotes tree planting, water quality, walkability and bikeability.
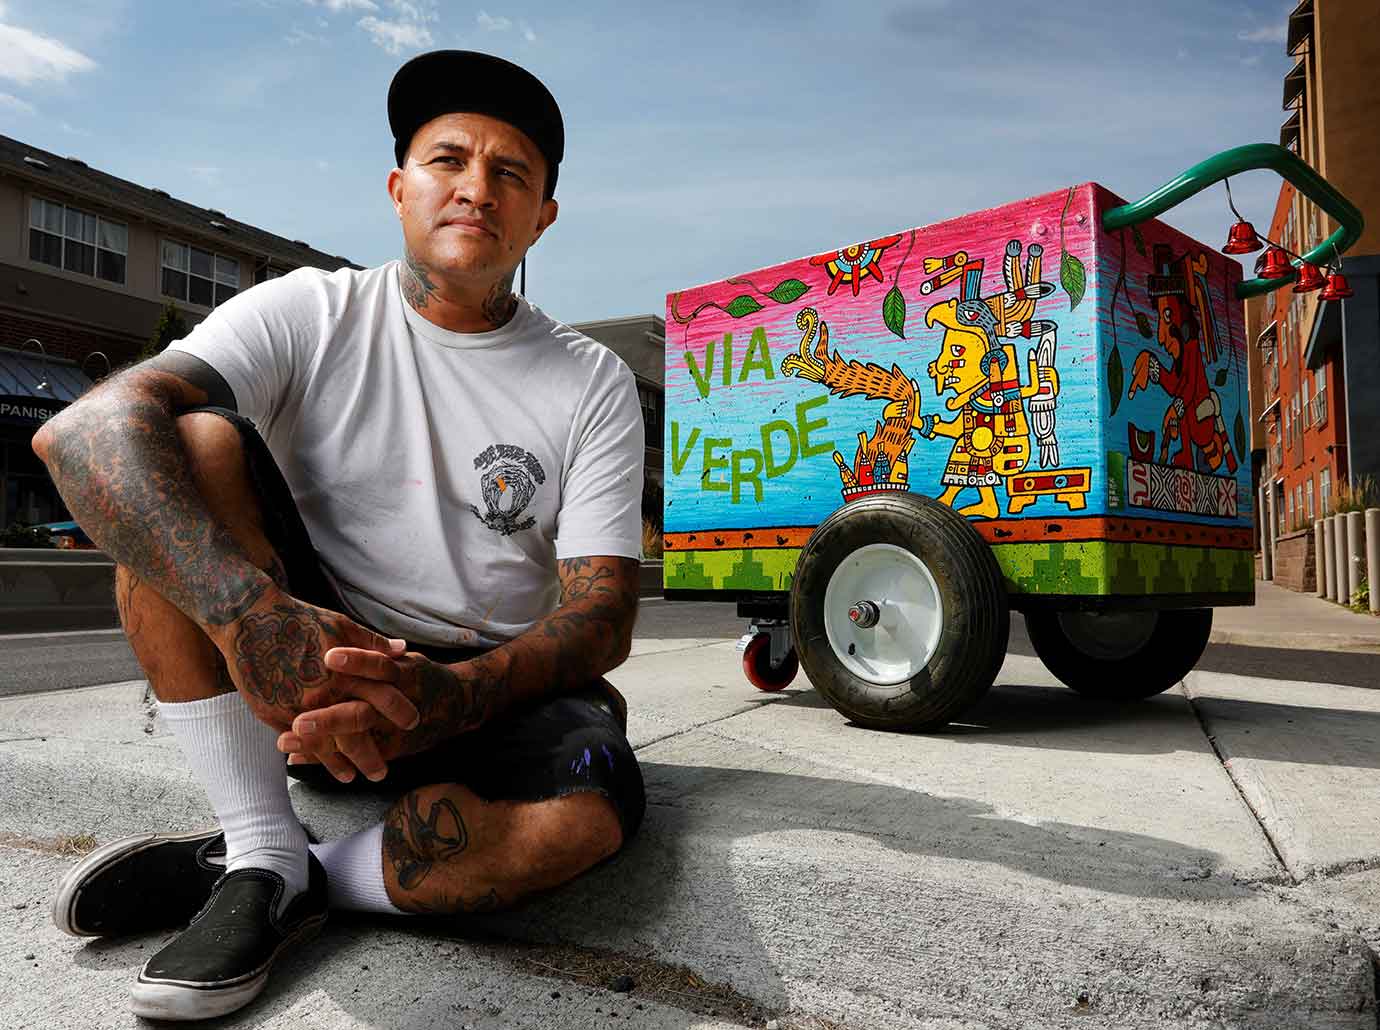
Some CCW initiatives will address climate and health through a cultural lens, to engage residents in ways that carry local meaning. For instance, Santiago Jaramillo is converting a handful of carts used by paleteros (people who make or sell popsicles and ice cream) into colorfully decorated weather stations that will circulate through the neighborhood. The carts will bear Native American and Aztec symbols that represent the earth, sky, rivers and trees. Each cart will contain equipment and instructions for measuring temperature, air and water quality, and other environmental indicators, as well as a “Mother Earth Wish List” where people can list neighborhood upgrades they’d like to see.
“It’s about the earth and the sacred traditions of our ancestors,” says Jaramillo. “We’ll provide information about climate change, but this is really about people’s spirituality. They relate to that differently. They may not know all the connections between the environment and their health, but this can help people become aware of them.”
That’s the same purpose the Heat Vulnerability Map is designed to serve, says DEH’s Babcock. “I don’t think anybody is adequately planning for extreme heat,” she says. “Under the worst-case scenario, we could be seeing more than a month of 100+ degree days every year by 2050, and that could really endanger people in these vulnerable neighborhoods. Hopefully, the map will help get the community engaged in identifying short, medium and long-term goals.”
Related Story: Low-income, Child, Elder Health Most At Risk for Climate Change
