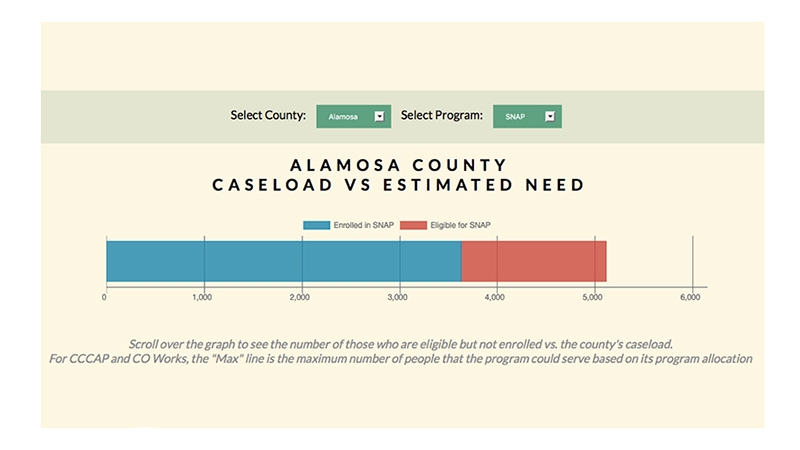
The ‘Gap Map‘ highlights county-level differences in how efficiently various assistance programs are provided, including metrics such as enrolled vs. eligible residents. Source: Human Services Gap Map
The ‘Gap Map‘ highlights county-level differences in how efficiently various assistance programs are provided, including metrics such as enrolled vs. eligible residents. Source: Human Services Gap Map
Low-income families with children can get help with health care, child care, food and even a small amount of cash each month to provide for basic needs. In Colorado, families and individuals apply for help through a county office, which administers an alphabet soup of acronyms like SNAP (Supplemental Nutrition Assistance Program, aka food stamps), WIC (Special Supplemental Nutrition Program for Women, Infants and Children), CCAP (Child Care Assistance Program), TANF (Temporary Aid to Needy Families, aka Colorado Works) and, to a certain extent, Medicaid.
Colorado is one of nine states in the nation where county employees, rather than the state, are in charge of social service programs. That means decisions about the programs—such as how to spend money, and make sure people who qualify for help are actually signing up for it—are made at the county level. (Medicaid is a bit of an outlier; while it has statewide standards and requirements, administration can vary by county.)
This can potentially create disparities according to which Colorado county someone lives in, should he or she qualify for and need such benefits.
The Colorado Center on Law & Policy (CCLP), Hunger Free Colorado, The Bell Policy Center, Colorado Covering Kids and Families and the Colorado Consumer Health Initiative collectively created the Human Services Gap Map, which ranks the top and bottom counties on their performance getting health coverage, child care and emergency cash assistance to people who need it. The Gap Map also shows how efficiently and effectively counties spend public money to provide these social services. Data sources for the Gap Map include state administrative agencies and the U.S. Census Bureau’s 2010-14 American Community Survey.
The top quartile of counties by performance are mostly in the southeast and south central part of the state. They include Alamosa, Bent, Cheyenne, Conejos, Costilla, Clear Creek, Crowley, Fremont, Gilpin, Huerfano, Las Animas, Montrose, Otero, Prowers, Pueblo and Rio Grande counties.
Many of the low-performing counties are in the north central and western parts of the state. The bottom quartile of counties includes Broomfield, Douglas, Eagle, Garfield, Grand, Gunnison, Jackson, Kiowa, Mineral, Ouray, Pitkin, Rio Blanco, Routt, San Juan, San Miguel and Summit counties.
For example, in Pueblo County, an estimated 6.5 percent of people who qualify for food stamps through the SNAP, or close to 2,500 people, were not getting the program’s help. Meanwhile, in Douglas County to the north, over 10,000 people with income low enough to qualify—or 63.5 percent of those eligible—were not getting food assistance, according to the Gap Map. (Compared to other states, Colorado overall is among the most ineffective at getting food stamps to people who need them.)
On the other hand, Douglas County has better success enrolling eligible people in Medicaid. Approximately 3,000 people in that county qualify for Medicaid but are not enrolled, or around 15 percent of eligible people, compared to 17 percent of eligible but not enrolled people on average statewide.
Another measure is how much money goes to help people, versus the cost of administering the help. For each dollar spent administering food assistance in Pueblo County between 2012 and 2015, $63.92 went to people who needed it, Gap Map research found. That’s over twice the average return on investment of other counties administering the same program, or $38.81 more.
By comparison, nearby Kiowa County SNAP recipients got $10.57 for each dollar the county spent on program administration—the lowest return on investment for the program in the state. Kiowa County spent the average amount administering assistance in the WIC program.
Why does spending vary so much from program to program and county to county?
“I have at least 50 theories,” said Chaer Robert, manager of the Family Economic Security Program at CCLP, a Trust grantee that collaborates with other organizations to advocate for health equity. Perhaps some counties do more outreach or others have more remote office locations, she said.
Robert hopes the Gap Map will prompt counties to talk about what works and what doesn’t, and learn new ways of delivering programs and reaching people who need help.